What are CDS Queries?
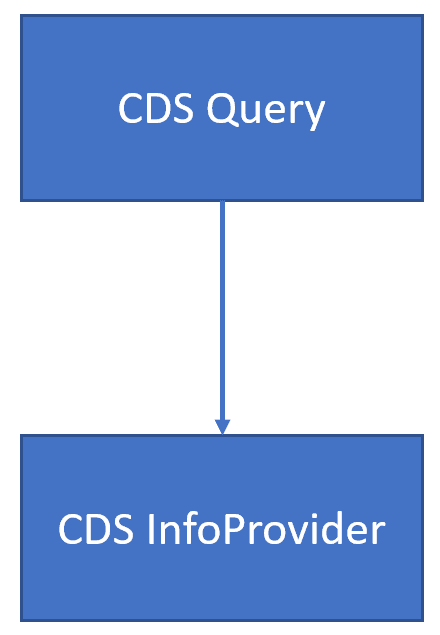
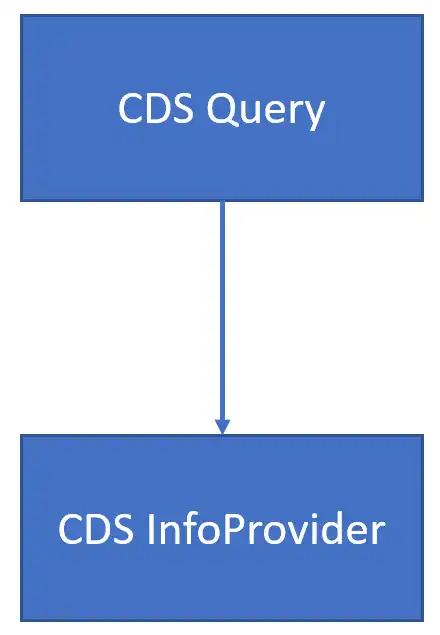
CDS queries can only read data from CDS InfoProviders
Reporting directly in the transactional ERP system (e.g. S/4HANA) using CDS Views is called Embedded Analytics. Here, the CDS Queries offer us the same options as with the SAP BW Queries from the Query Designer. They can also be consumed in the same tools, e.g. in transaction RSRT or in Analysis for Office and can be included in Fiori tiles. In this article we want to show the most important elements of the queries and at the end provide a query template as a copy template, which can serve as a starting point for your own CDS Queries.
A query CDS View can only read from a CDS InfoProvider read.
The CDS InfoProvider is defined by the @Analytics.DataCategory: #CUBE or #DIMENSION annotation. It comes along with some features that are inherited by the query. These include:
- Links from the Cube to the Dimension Views
- Links from the Dimension Views to the associated Text Views
- Aggregation behavior of key figures
- Semantic classification of the fields
- Dependencies between fields
The CDS InfoProviders model these properties centrally and can be reused in multiple queries. In many respects, they correspond to a Composite Provider in SAP BW. We dedicated a separate blog post to building CDS InfoProviders.
Analytic Annotations at view level
A CDS View becomes a CDS Query using the following Analytic Annotation:
@Analytics.query: true
This makes the CDS View visible under the name of the SQL View with the 2C prefix in the tools, for example in the RSRT transaction or in Analysis for Office. At the level of the view, the representation of zeros can then be specified:
@Analytics.settings.zeroValues: { handling:   #HIDE\_IF\_ALL, // #HIDE, #SHOW
                                  hideOnAxis: #ROWS\_COLUMNS // #COLUMNS, #ROWS
}
Analytic Annotations at field level
In this section, the individual annotations are grouped by topic. In each case, we have selected the most important annotations. For further details, we recommend you to take a look at SAP's reference documentation.
The display text for all fields can be set like this:
@EndUserText.label: ''
Parameters for filtering in CDS Queries
Input parameters can be implemented either as CDS parameters or, for filtering only, using the @Consumption.filter annotation. The CDS parameters are always single values that can be used arbitrarily in expressions. For example, in calculations or as parameters for SQL functions. Filters via annotations are not limited to single values; list of single values, select options, single or multiple hierarchy nodes. The two concepts can also be combined.
  @Consumption.filter:{ selectionType:      #RANGE,       // #INTERVAL, #SINGLE, #HIERARCHY\_NODE
                        multipleSelections: false,
                        mandatory:          true,
                        hidden:             false,        //Default: false
                        defaultValue:       '0000000000011675'  }
Annotations for rows (features)
  @AnalyticsDetails.query:{ display:       #KEY,    //#KEY\_TEXT, #TEXT
                            axis:          #ROWS,   //#COLUMNS
                            totals:        #HIDE,   //#SHOW
                            hidden:        false,   //Default: false
                            sortDirection: #ASC     //#DESC
  }
Annotations for key figures
Key figures are displayed as a column by default. The associated annotation can be omitted. The decimal places are set with decimals . With scaling the value can be shifted by powers of ten. This is practical if, for example, only TEUR (=thousand euros) is to be reported instead of EUR.
@AnalyticsDetails.query:{ axis:     #COLUMNS,  //optional - Standard value for keyfigures
                          decimals: 2,         //Decimals
                          scaling:  0,         //Default value - to scale by powers of 10
                          hidden:   false      //true = initialy invisible
}
Calculations with formulas
The annotation @AnalyticsDetails.query.formula can be used to perform calculations in the query. These are only performed when the CDS View is processed by the OLAP processor. In a data preview, we do not see these calculations.
  @EndUserText.label: 'Profit'
  @AnalyticsDetails.query:{ formula: '(price\_vk - price\_vek) \* nodim(quant\_b)' }
  1 as profit,
Exception aggregation
  @EndUserText.label: 'Anzahl Belege'
  @AnalyticsDetails.exceptionAggregationSteps:
              \[{ exceptionAggregationBehavior: #COUNT,
                 exceptionAggregationElements: \['doc\_number'\] }\]
    1 as doc\_count
Annotations for free features
All metrics that have not been distributed to the #ROW and #COLUMN axes using the @AnalyticsDetails.query.axis annotation are free features. This means that they are not present in the initial drilldown of the query, but can be added to one of the two axes as desired. This is specified with the following annotation, which is optional for features:
@AnalyticsDetails.query.axis: #FREE`
The query template
I use this query template as a copy template for my queries. The comments contain the other possible values for the annotations. You will get them suggested with the code completion as well, but this way all the possibilities can be visualized clearer.
@AbapCatalog.sqlViewName: 'ZSQL\_DEMO\_QUERY'
@EndUserText.label: 'Demo Query'

@Analytics.query: true
@Analytics.settings.zeroValues: { handling:   #HIDE\_IF\_ALL, // #HIDE, #SHOW
                                  hideOnAxis: #ROWS\_COLUMNS // #COLUMNS, #ROWS
}
define view zcds\_demo\_Query
  as select from ZJB\_DEMO\_cube
{

///////////////////
// Parameter
///////////////////
  @EndUserText.label: 'Kennzahl (Menge)'
  @Consumption.filter:{ selectionType:      #RANGE,       // #INTERVAL, #SINGLE, #HIERARCHY\_NODE
                        multipleSelections: false,
                        mandatory:          true,
                        hidden:             false,
                        defaultValue:       '0000000000011675'  }

  @AnalyticsDetails.query:{ hidden: true }
  measure,

///////////////////
// Merkmale
///////////////////
  @AnalyticsDetails.query:{ display:       #KEY,
                            axis:          #ROWS,
                            totals:        #HIDE,
                            sortDirection: #ASC  }
  calday,


///////////////////
// Kennzahlen
///////////////////
  @AnalyticsDetails.query:{ decimals: 4}
  price\_vk,

  @AnalyticsDetails.query.hidden: true
  price\_vek,

  @AnalyticsDetails.query:{ decimals: 0}
  quant\_b,

// Formel
  @EndUserText.label: 'Profit'
  @AnalyticsDetails.query:{ formula: '(price\_vk - price\_vek) \* nodim(quant\_b)' }
  1 as profit,

// Ausnahmeaggregation
  @EndUserText.label: 'Unterschiedl. Artikel'
  @AnalyticsDetails.exceptionAggregationSteps:
              \[{ exceptionAggregationBehavior: #COUNT,
                 exceptionAggregationElements: \['material'\] }\]
  1 as materialCount,


///////////////////
// Freie Merkmale
///////////////////
  @EndUserText.label: 'Material'
  @AnalyticsDetails.query:{ display:       #KEY\_TEXT,
                            axis:          #FREE,
                            totals:        #HIDE}
  material,
  doc\_currcy,
  base\_uom
}

### Conclusion
This summary came about while I was working for the Cheat Sheet CDS poster, as I needed to sort through the topics for myself a bit more. So far I had not worked cleanly and the separation between CDS Queries and CDS InfoProvider was blurred. I have left out the hierarchies so far in this post. If I ever need them and gain experience with them, I will include that here. If you are missing something important, if you find errors or just want to give me a feedback, I'd be happy about comments.