With AMDP debugging in transformation routines on BW/4HANA, errors can be easily found. An excerpt from my book "SQLScript for SAP HANA", published by Rheinwerkverlag, SAP Press.
AMDP debugger in the ADT (ABAP Development Tools)
The AMDP debugger is available in the releases SAP HANA 1.0 SPS9 (and higher), also in the releases SAP NetWeaver 7.50 (and higher). It can be used to debug AMDP procedures without direct access to the SAP HANA database and without a SAP HANA user. While it is a different debugger than its ABAP counterpart, the two are well integrated into the same Eclipse interface. You can also set breakpoints for the AMDP code when debugging in ABAP code and thus debug into it. Only on the display of the debugging sessions you can see that you are now on another level (see figure).
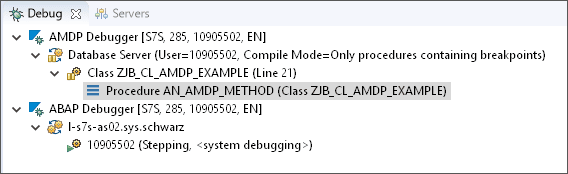
Debugger in Eclipse: AMDP and ABAP debugging in parallel
Status of the AMDP debugger and of the breakpoints
The AMDP debugger must be started before use. This happens either automatically when you set a breakpoint or manually by selecting it from the context menu of line numbers within the SQLScript code of an AMDP method

Activate the AMDP debugger via context menu
A breakpoint is represented as a small round circle to the left of the line number (see Figure 1.21) in the AMDP debugger, as well as in the ABAP debugger. The color of the circle depends on the status of the breakpoint. You can see the different meanings in the table:
| Color | Meaning |
| Blue | Only shortly, directly after setting the breakpoint. The routine must be compiled again for debugging. |
| Green | The breakpoint is confirmed and the debugger is active. |
| Gray | The debugger is inactive. It can be activated through the context menu on the breakpoint. |
| White | The breakpoint is disabled. It can also be activated through the context menu on the breakpoint itself. |
Status of the breakpoint markers
After 10 minutes of inactivity, the debugger deactivates itself. The reason for this is that an activated debugger requires relatively many resources on the ABAP server side.
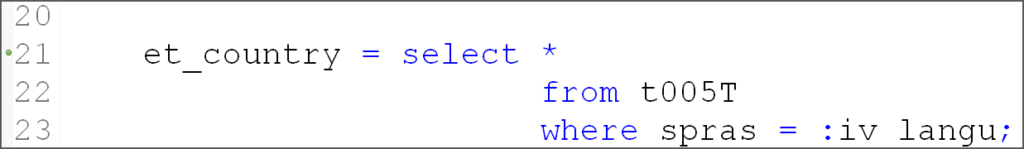
Marking an active breakpoint to the left of the line numbers
Debugging of BW transformation routines
AMDP debugging can also be used for debugging BW transformation routines. All you have to do is call the corresponding AMDP class in the ADT and set a breakpoint in the respective method at the desired position. For SAP BW/4HANA systems, you must make sure that you set the breakpoint in the A class. After that, check if the round symbol for the breakpoint is green and thus the AMDP debugger has been activated. When executing the data transfer process, the AMDP debugger then automatically stops at the breakpoint.
Note: Debugging problems
If the debugger does not stop, this can have different reasons. The most common source of errors when debugging in SAP BW/4HANA systems is that the breakpoint was not set in the A class.
With older system versions of SAP BW on SAP HANA, you sometimes have to select the execute-in-background option so that the system stops at the breakpoints. This in fact will load data!
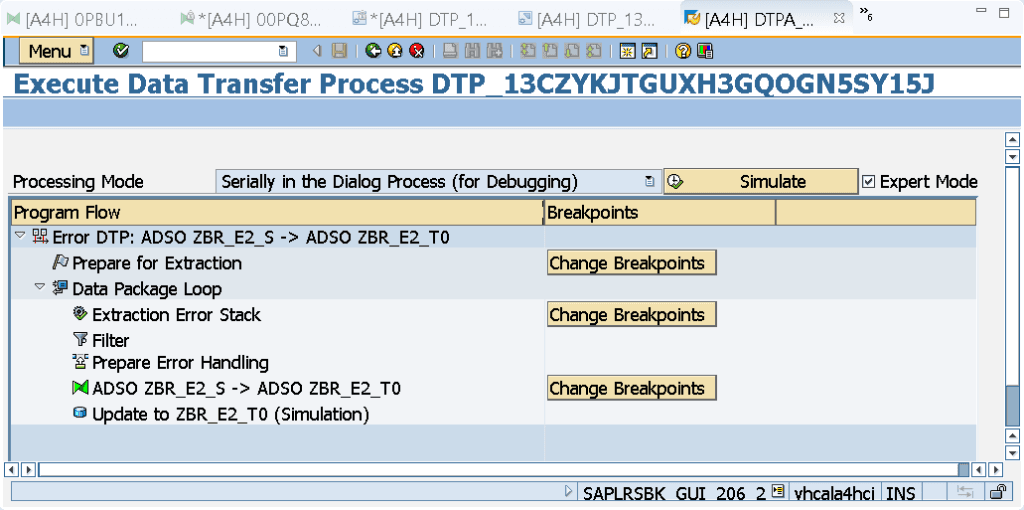
Processing mode options in DTP
On newer system versions, however, I have also experienced that a breakpoint was only stopped if, in addition to the 'Serially in the Dialog Process' option (for Debugging) , the Expert Mode checkbox was also checked (see illustration).
If necessary, try out what works for your system version.
Debug mode vs. optimized mode
In order to be able to analyze procedures with the AMDP debugger, they are being compiled again in the so-called debug mode. This means that, in oppostie to the optimized mode, some optimizations are not performed.